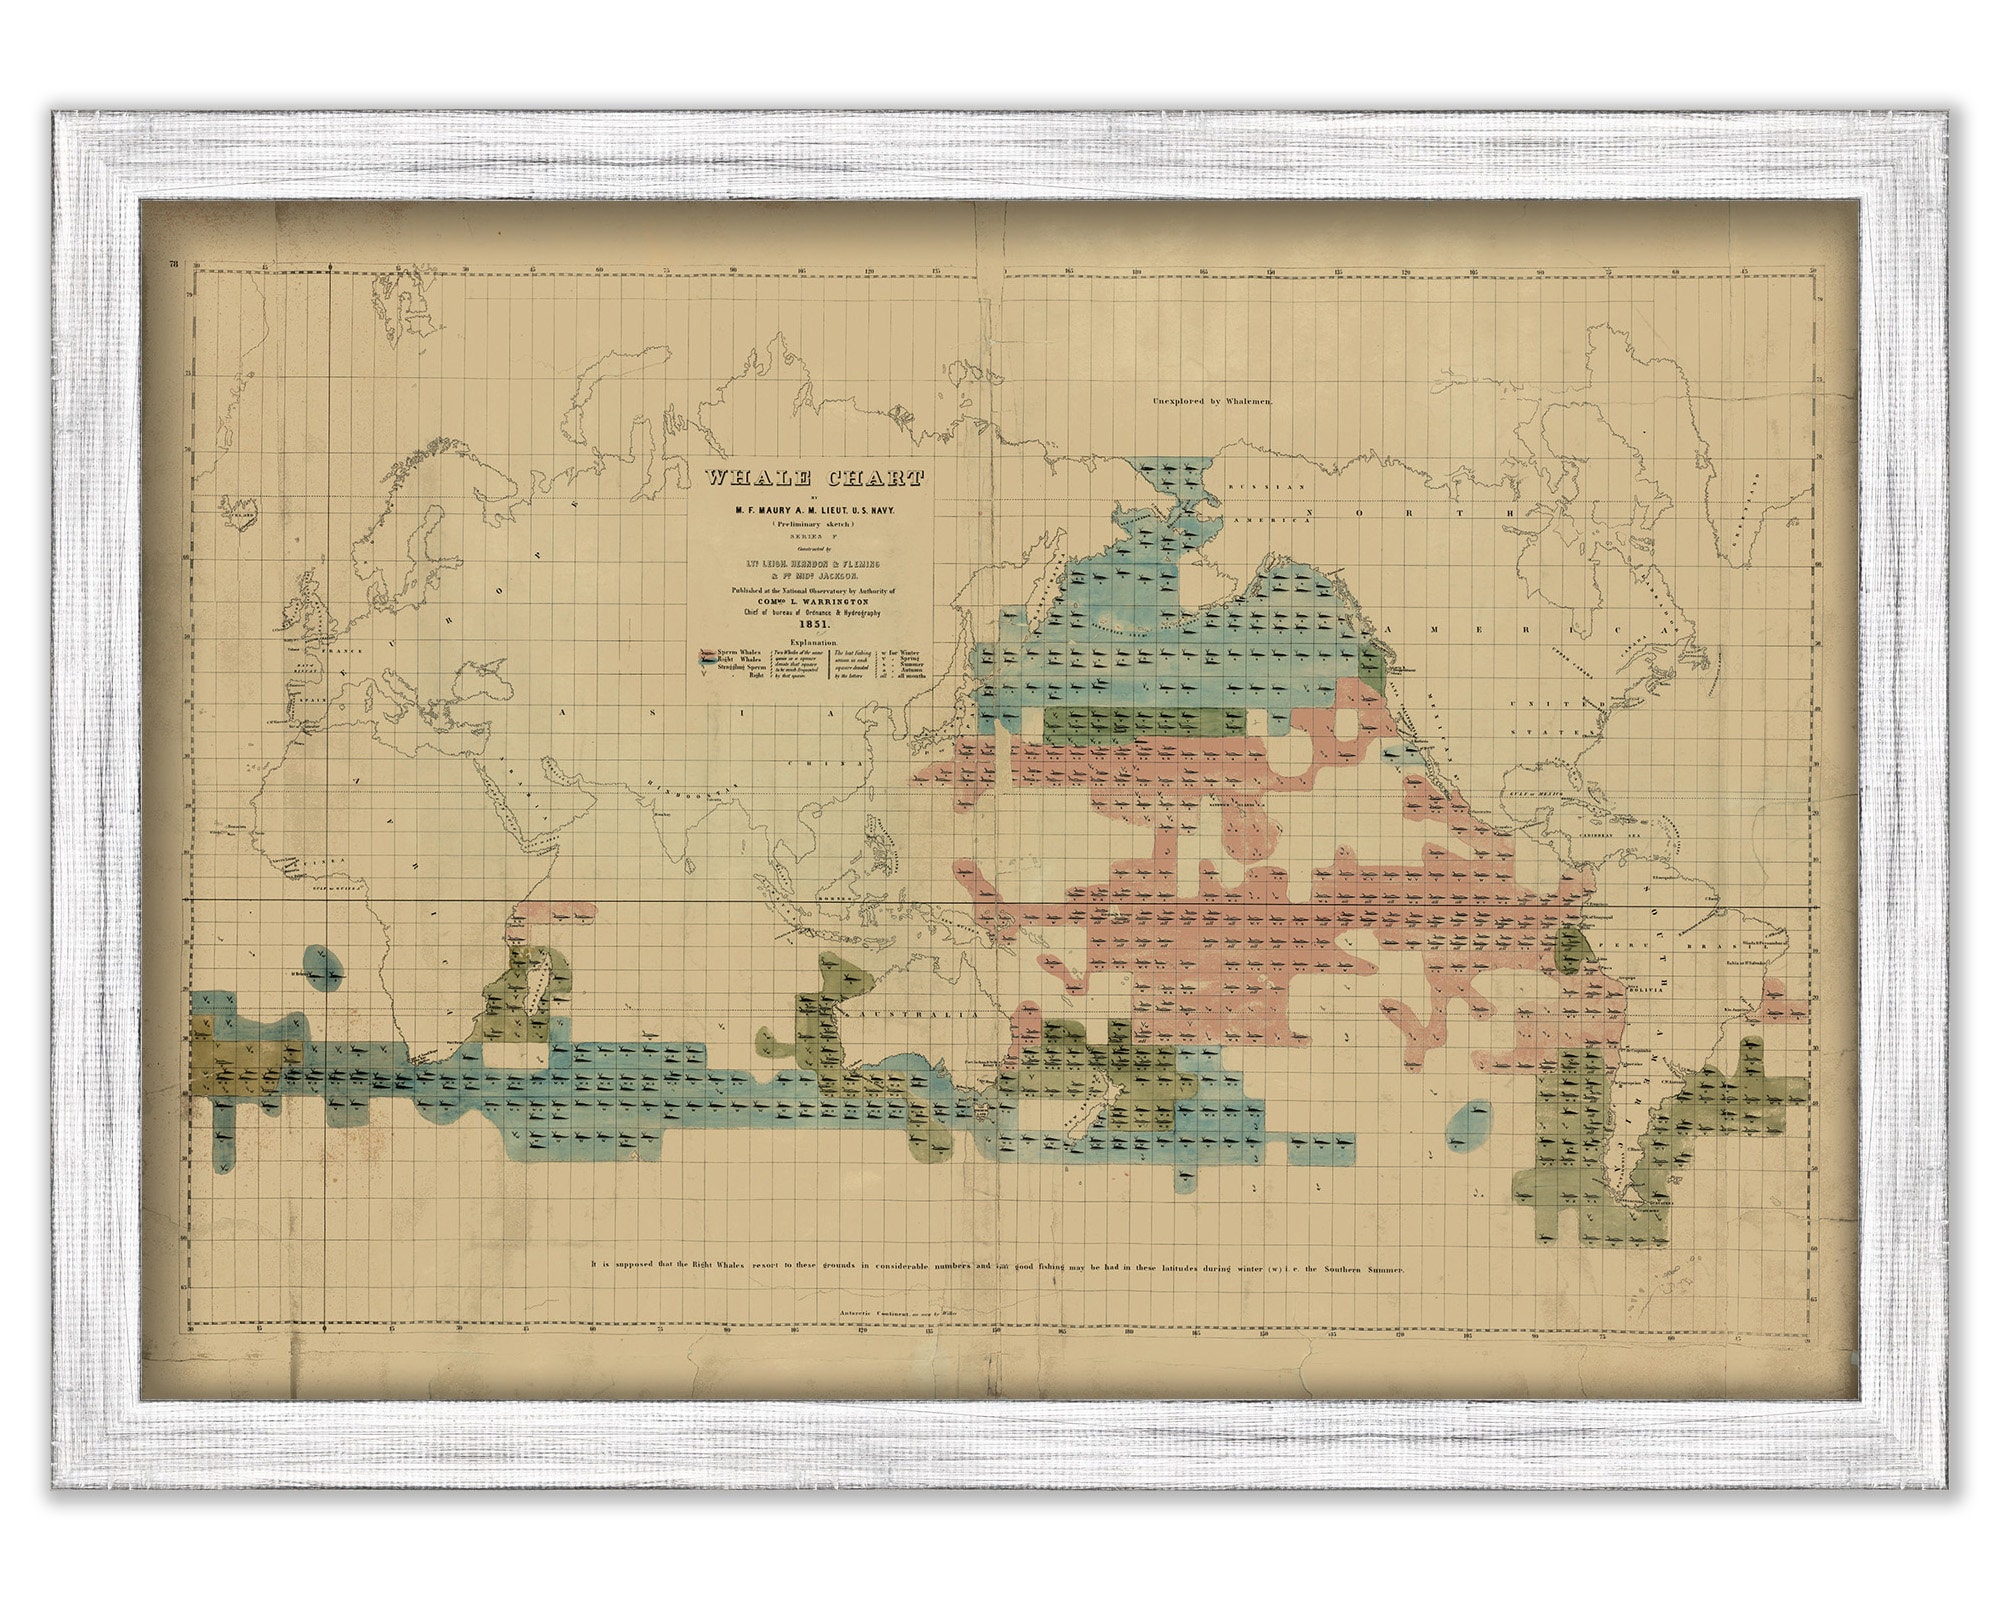
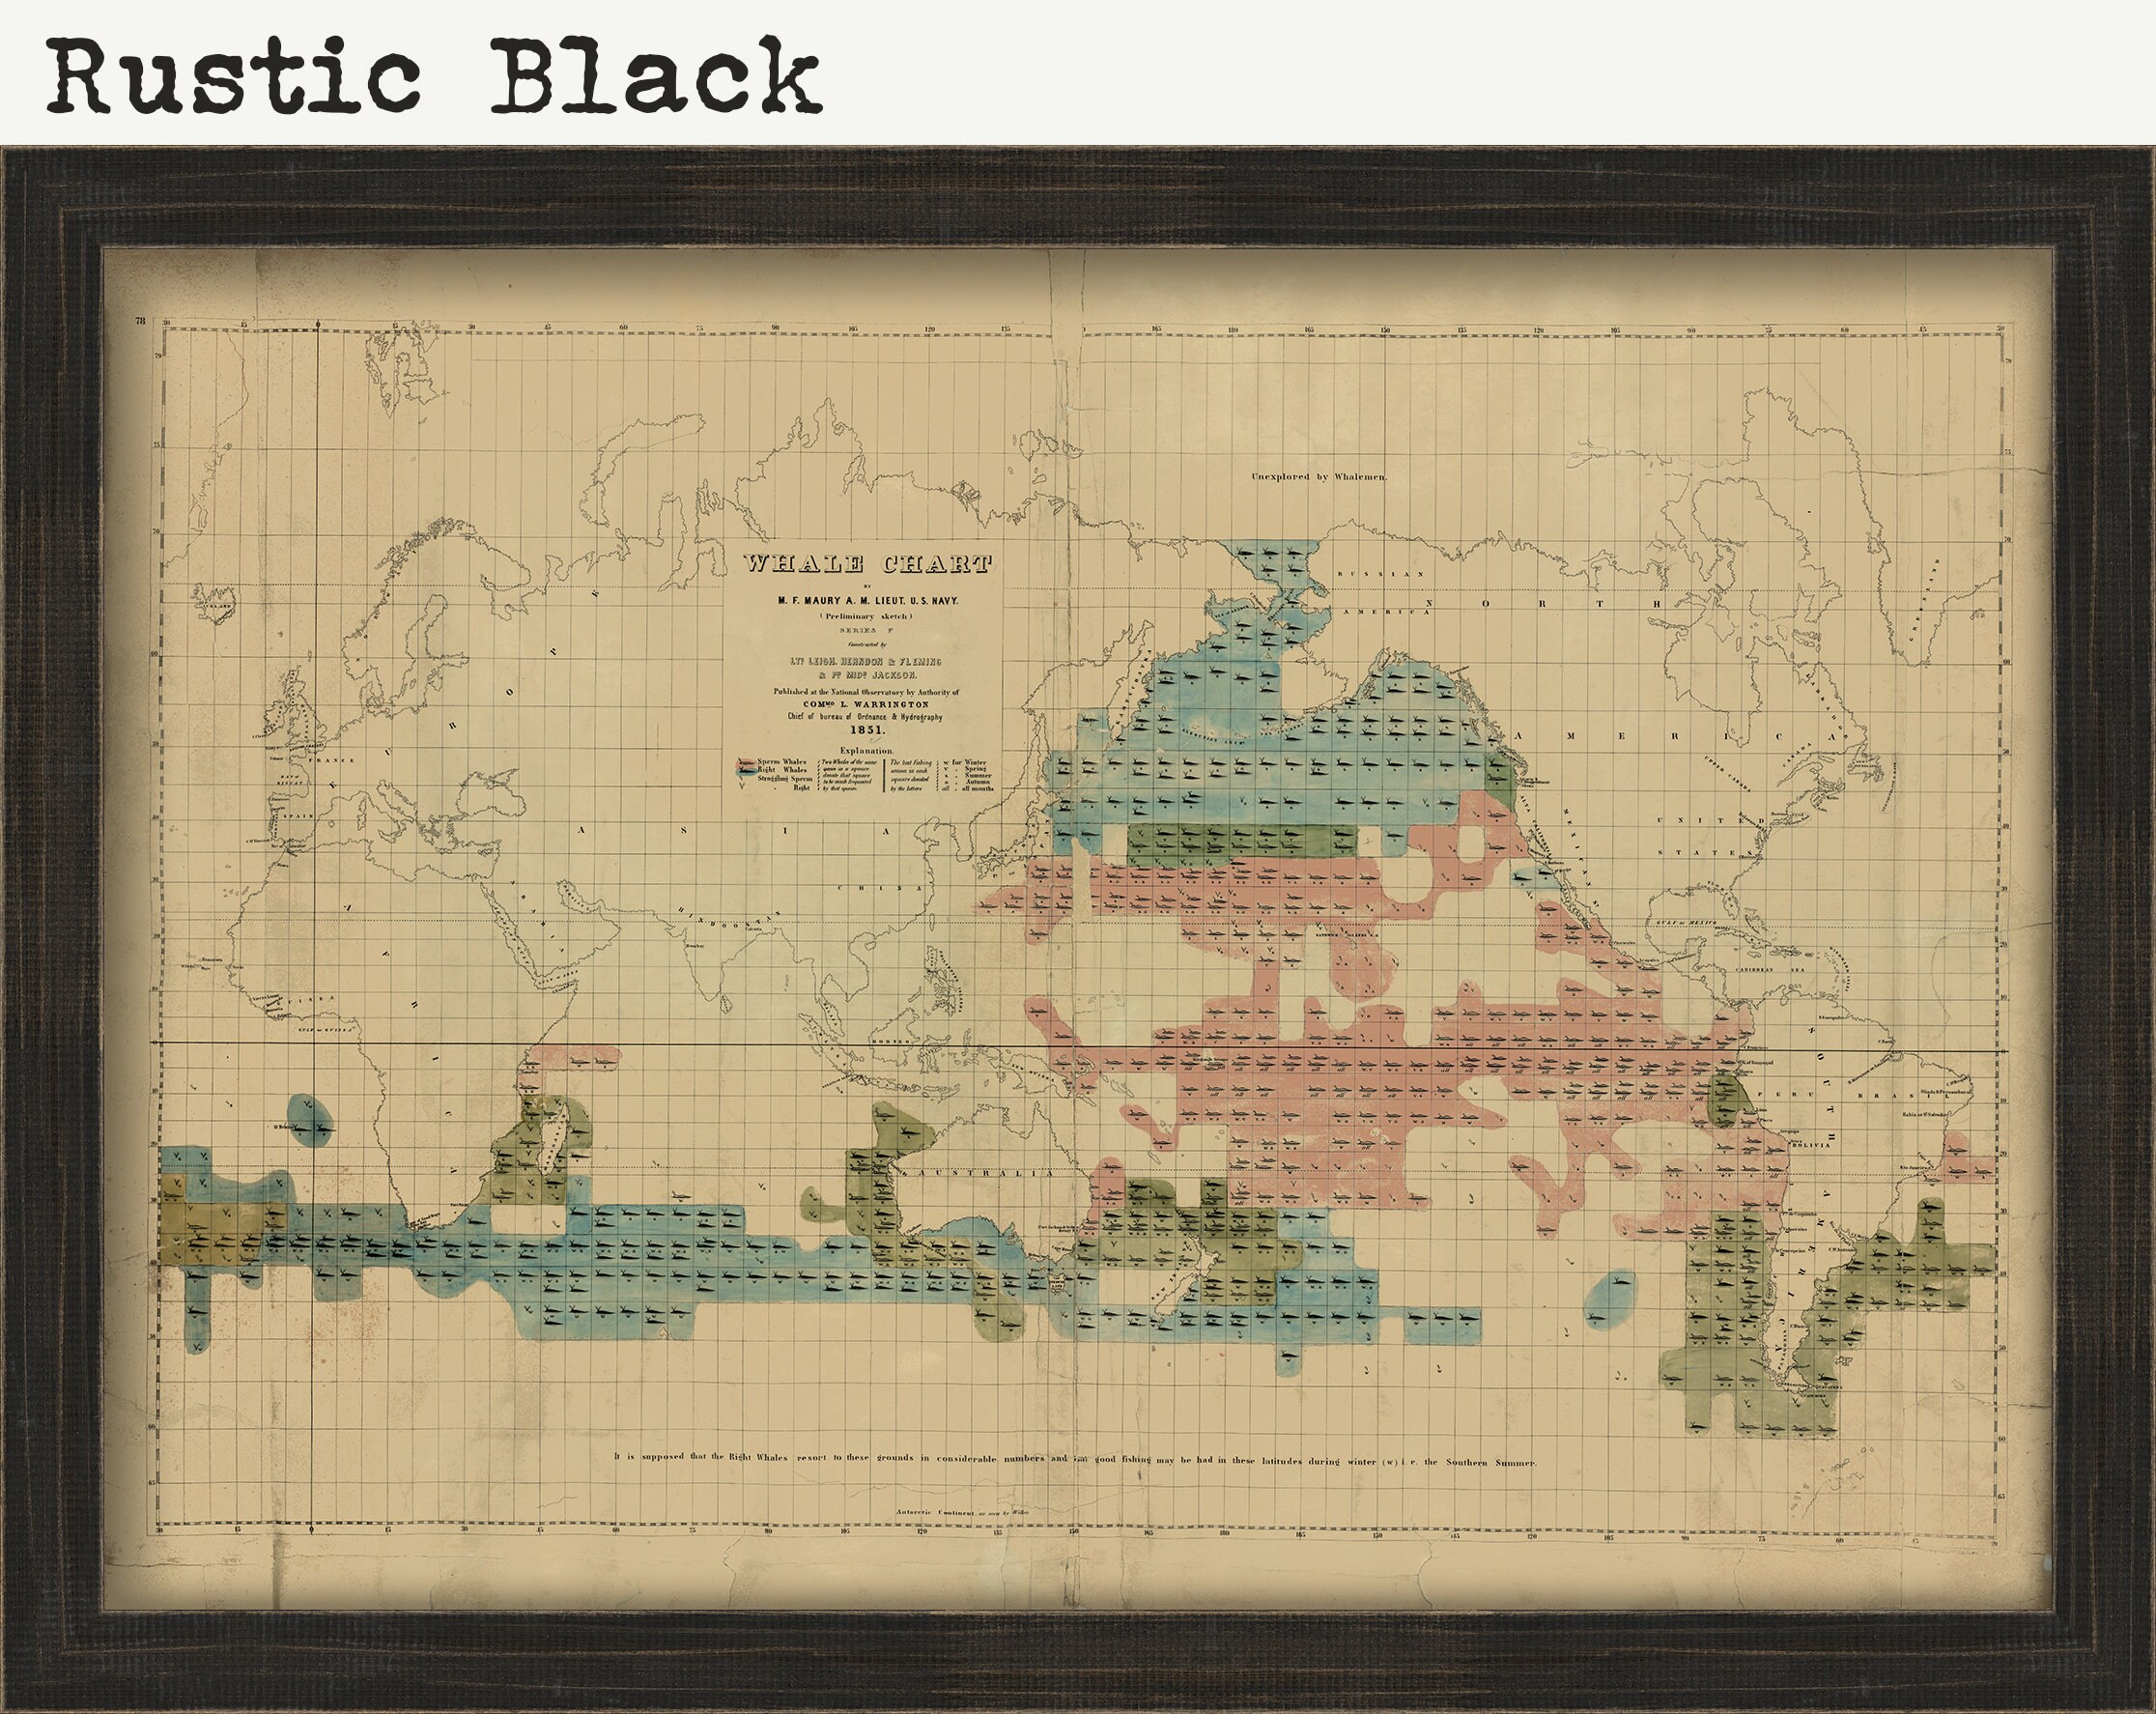
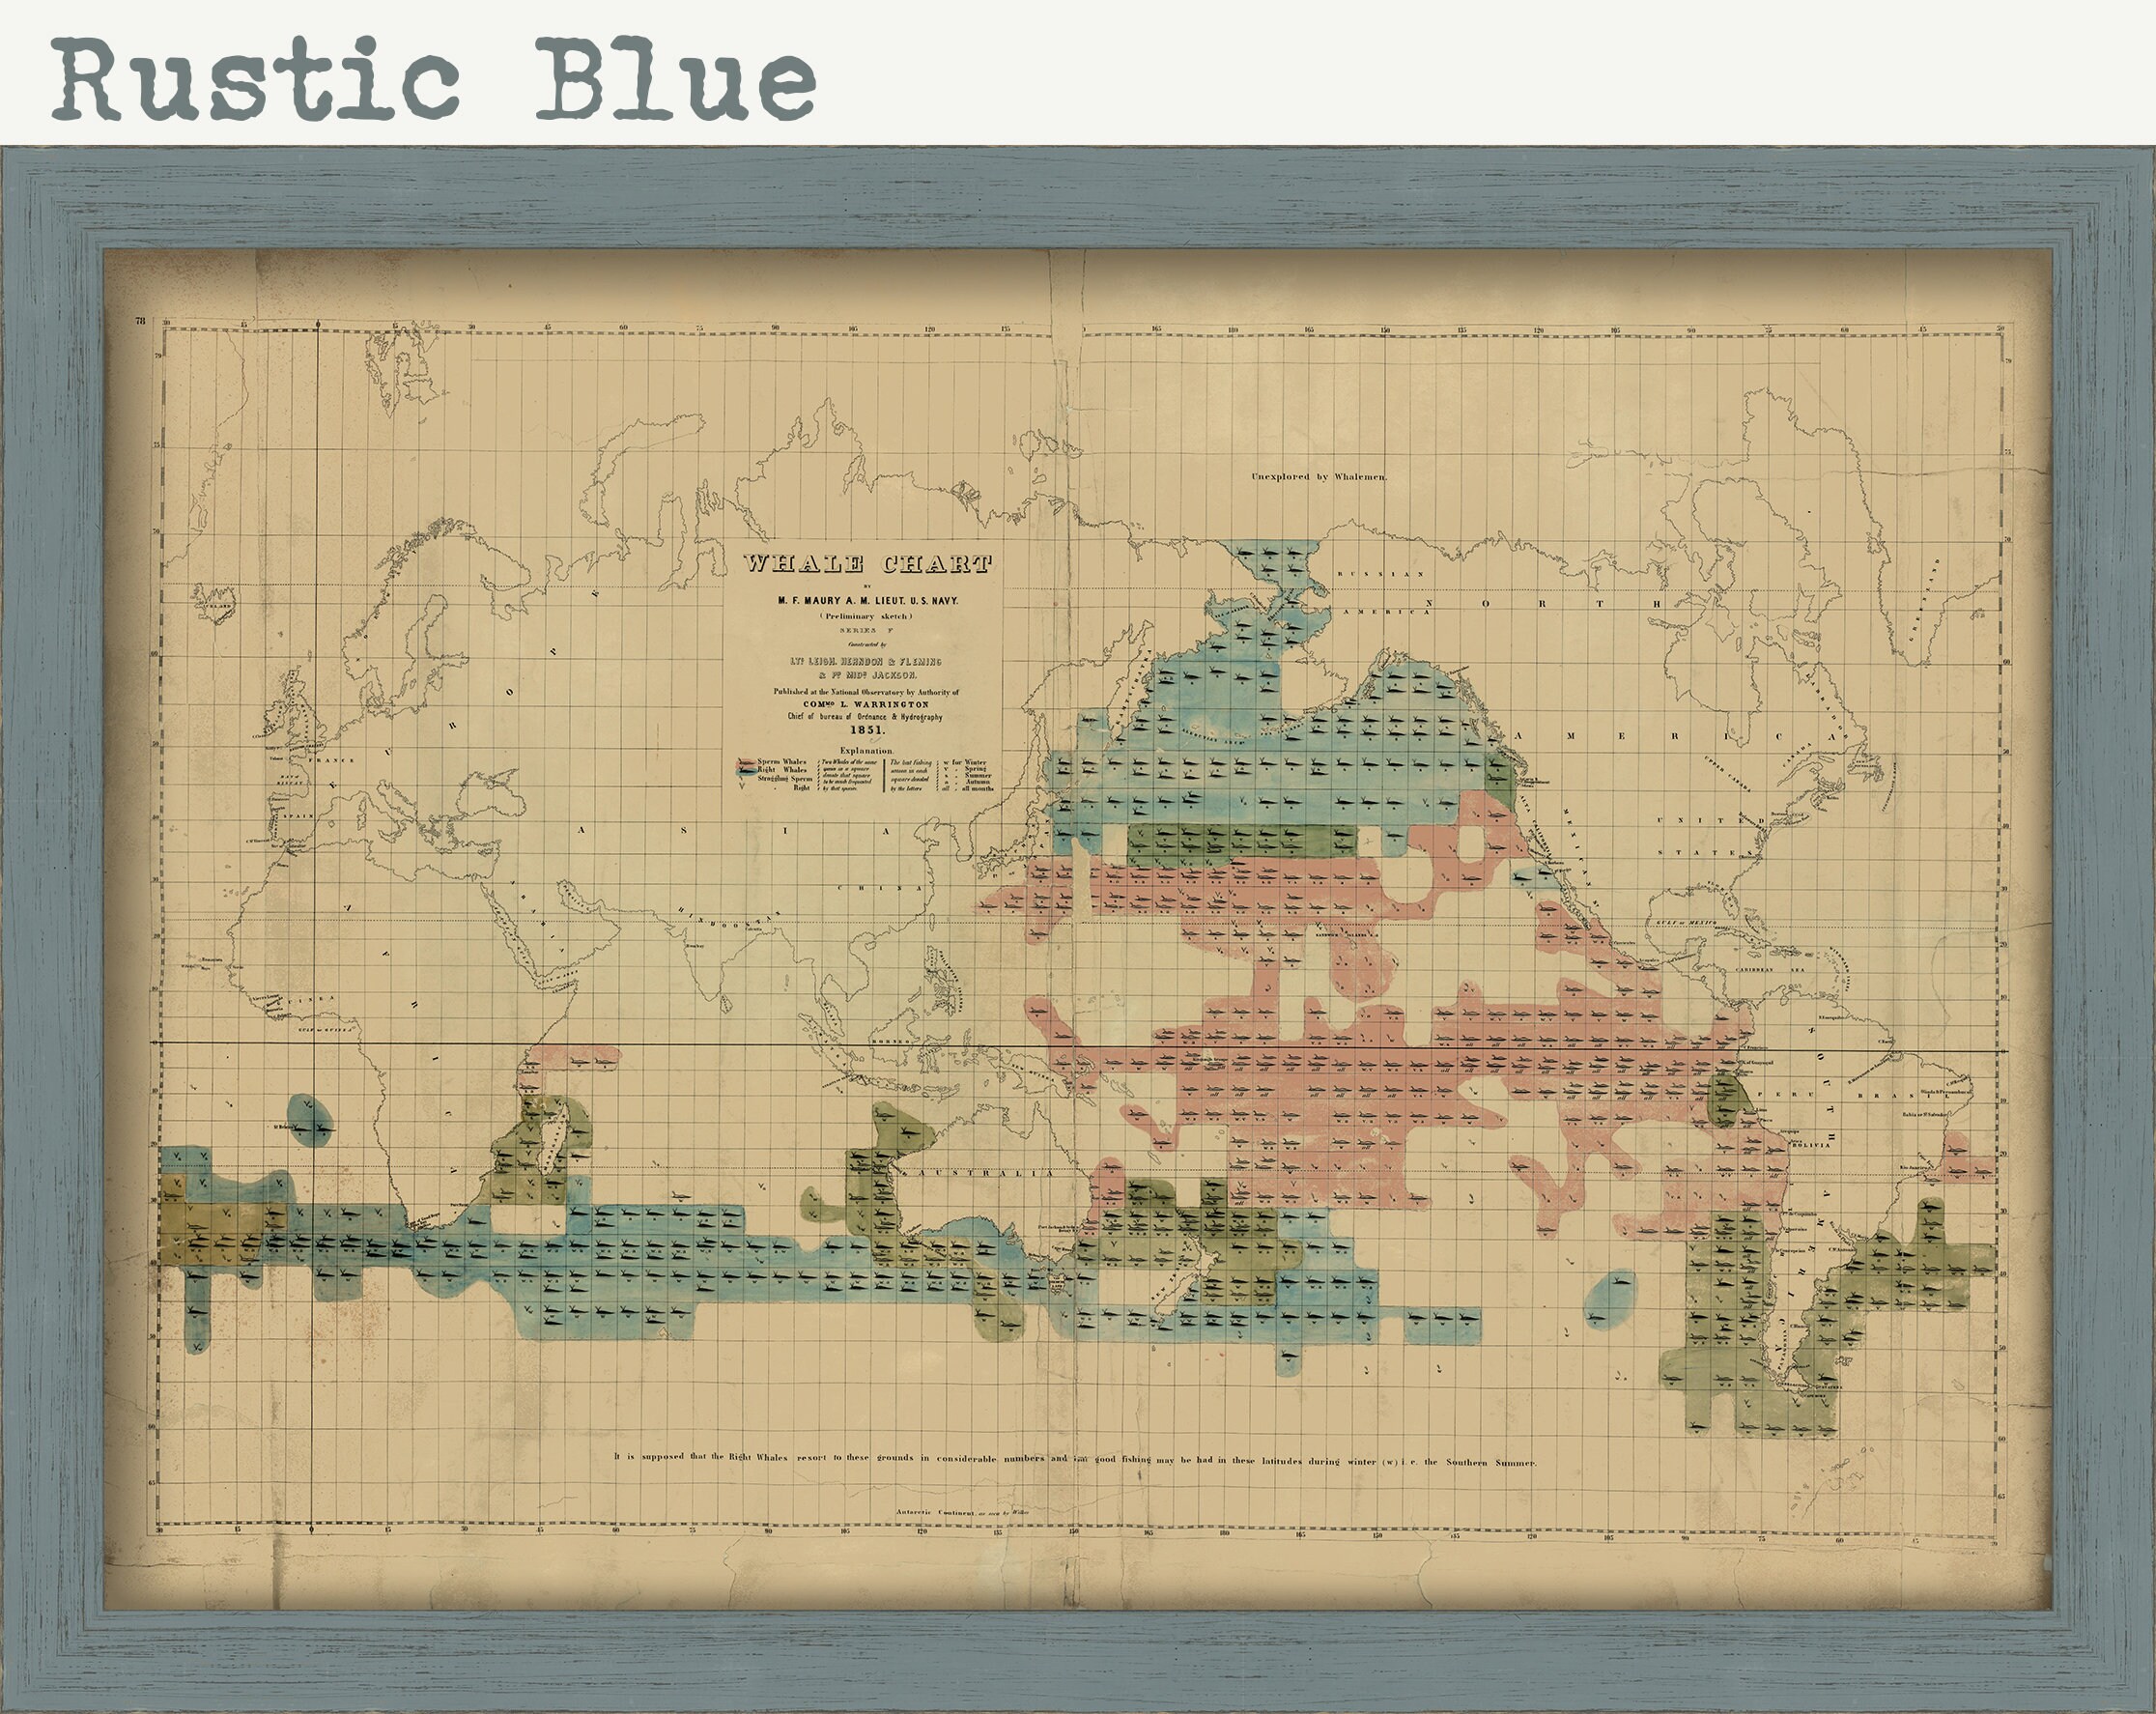
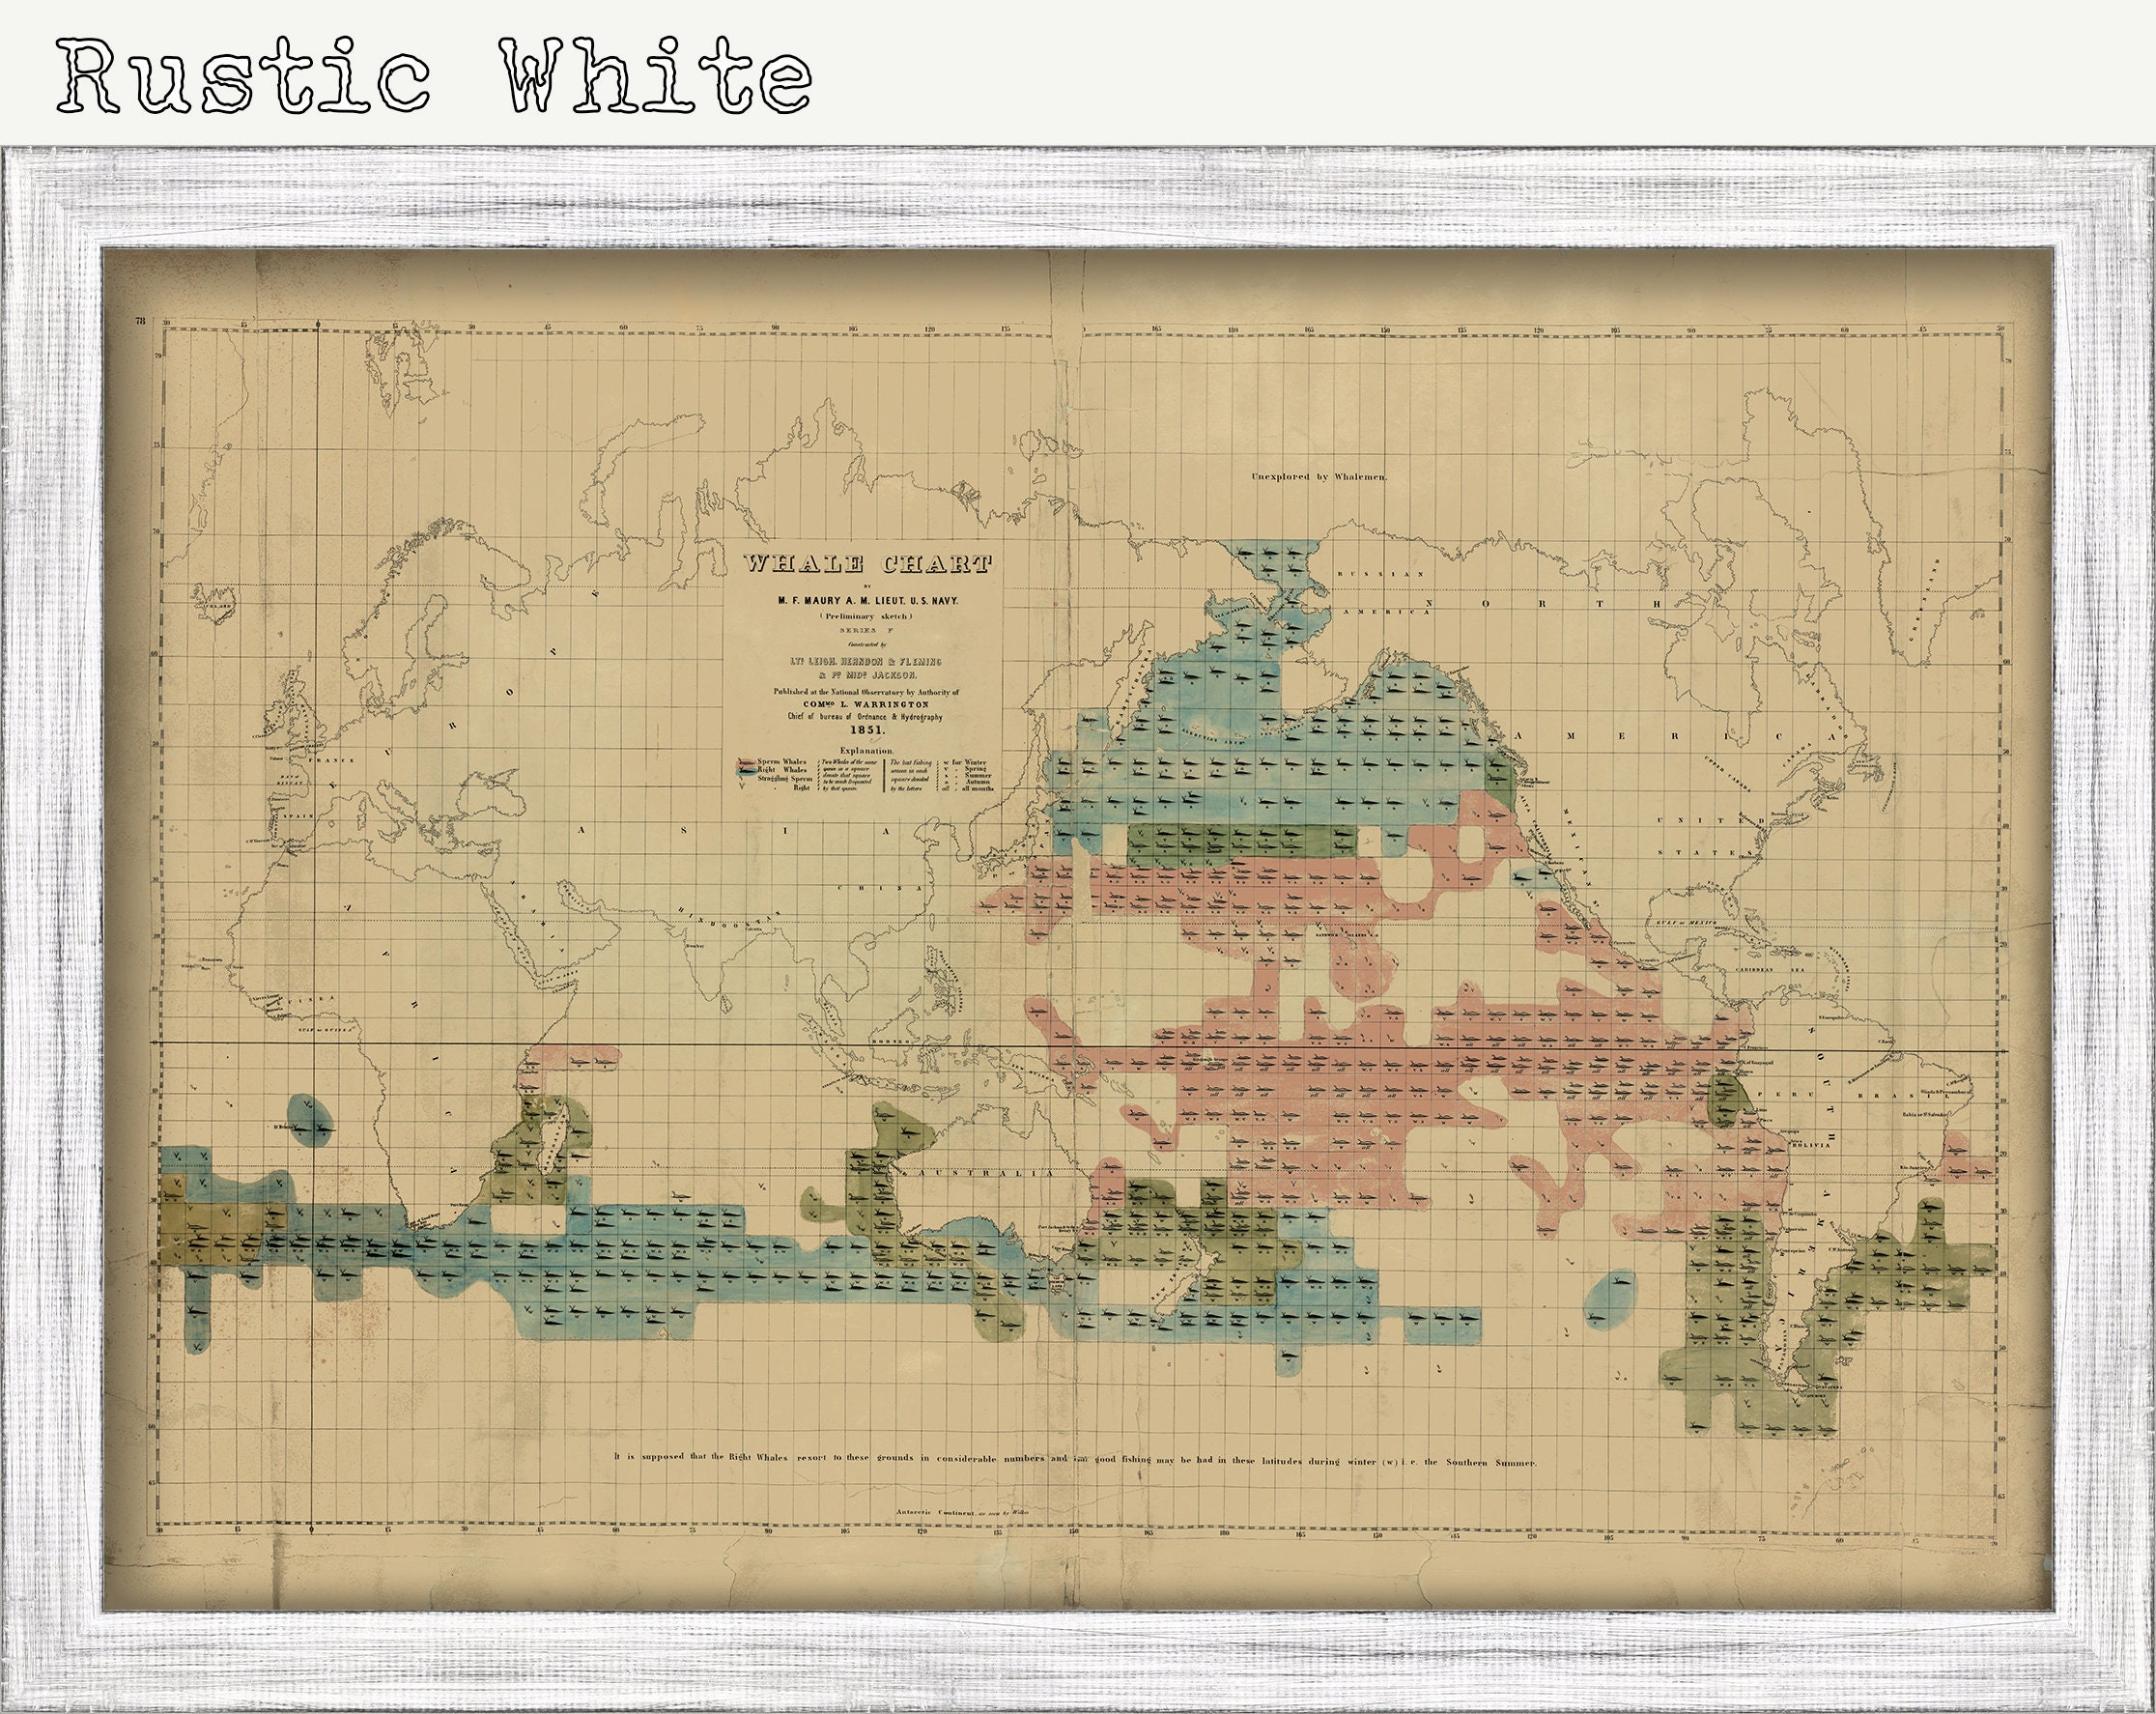

WHALE CHART - Drawn by Matthew Fontaine Maury, Lieutenant U. S. Navy in 1851
$37.00
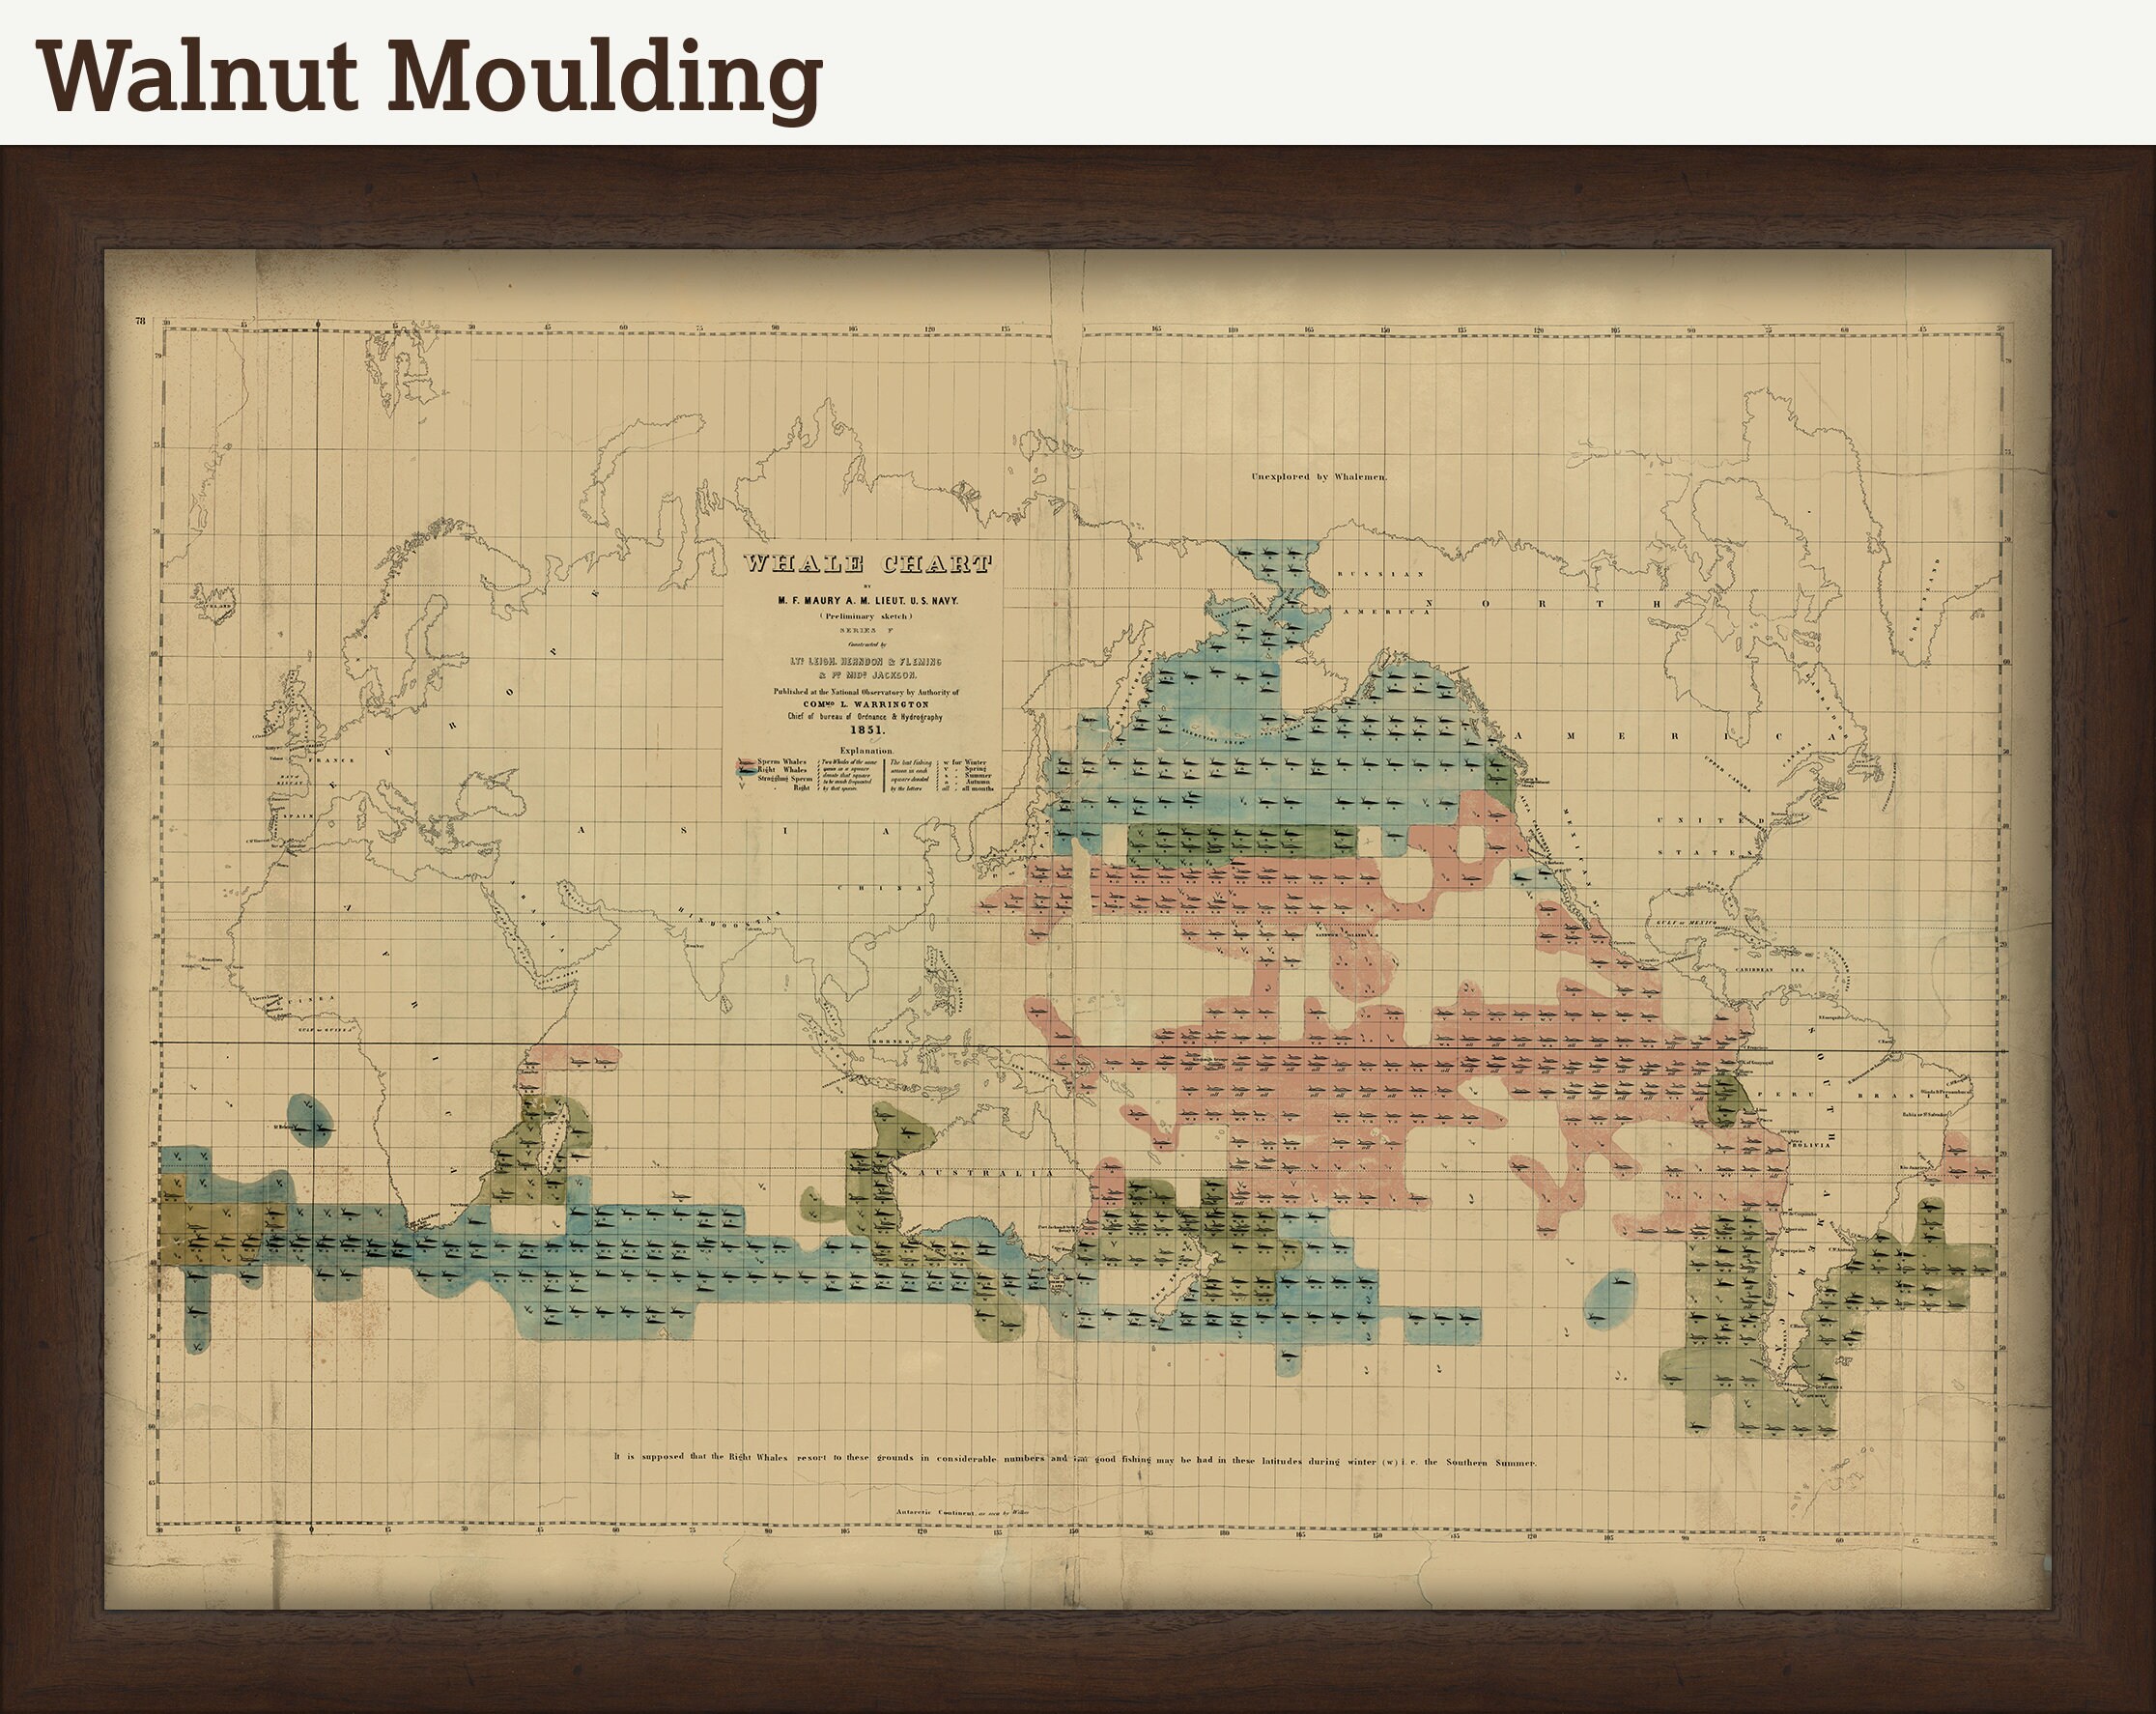
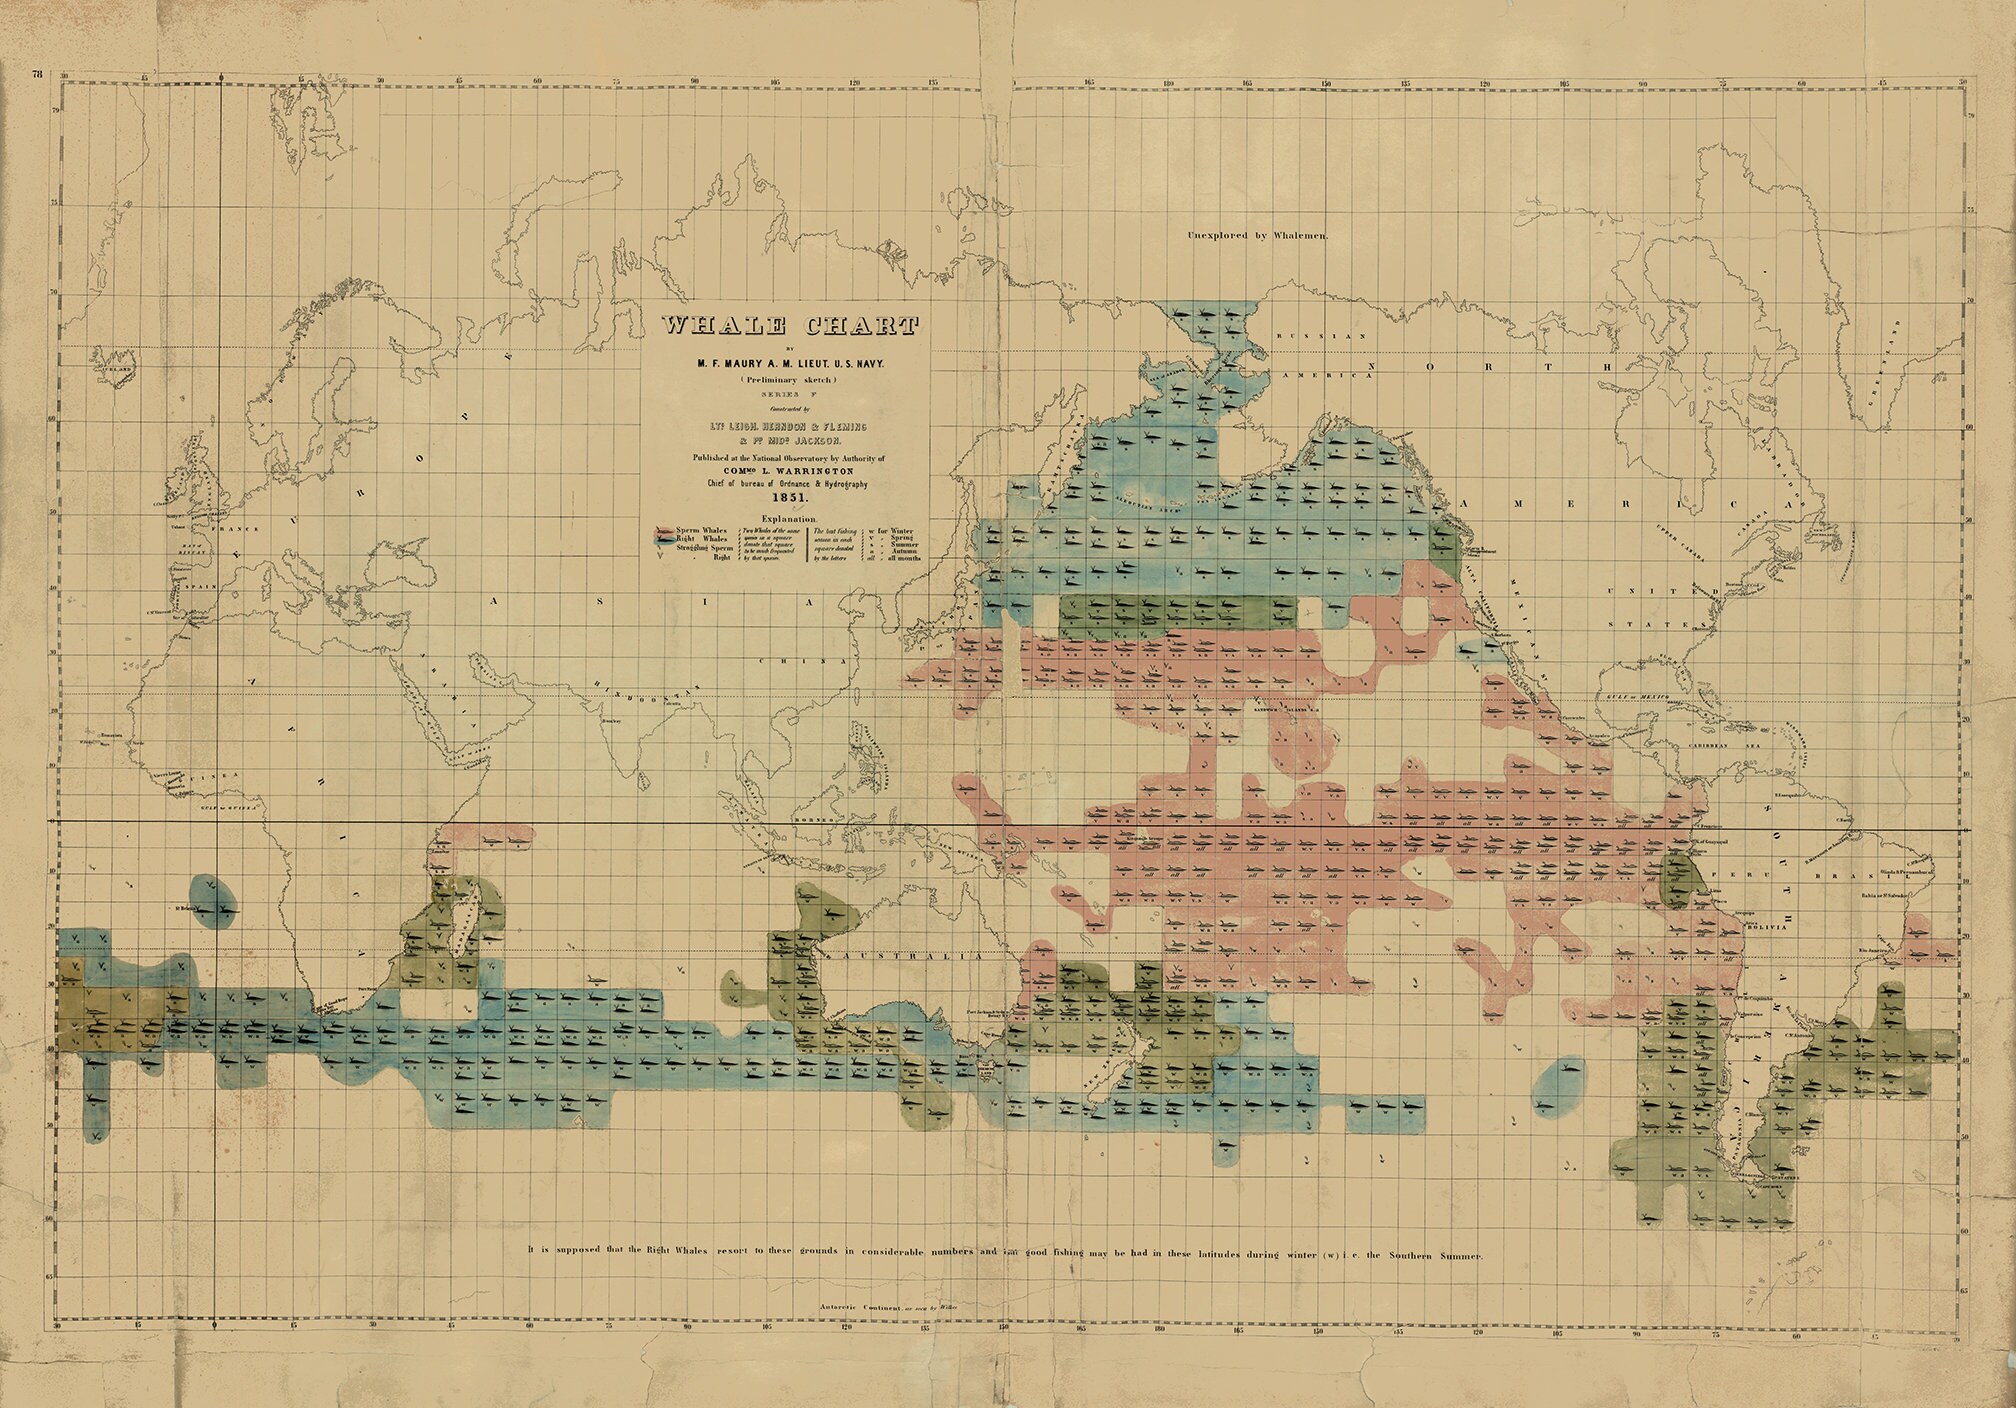
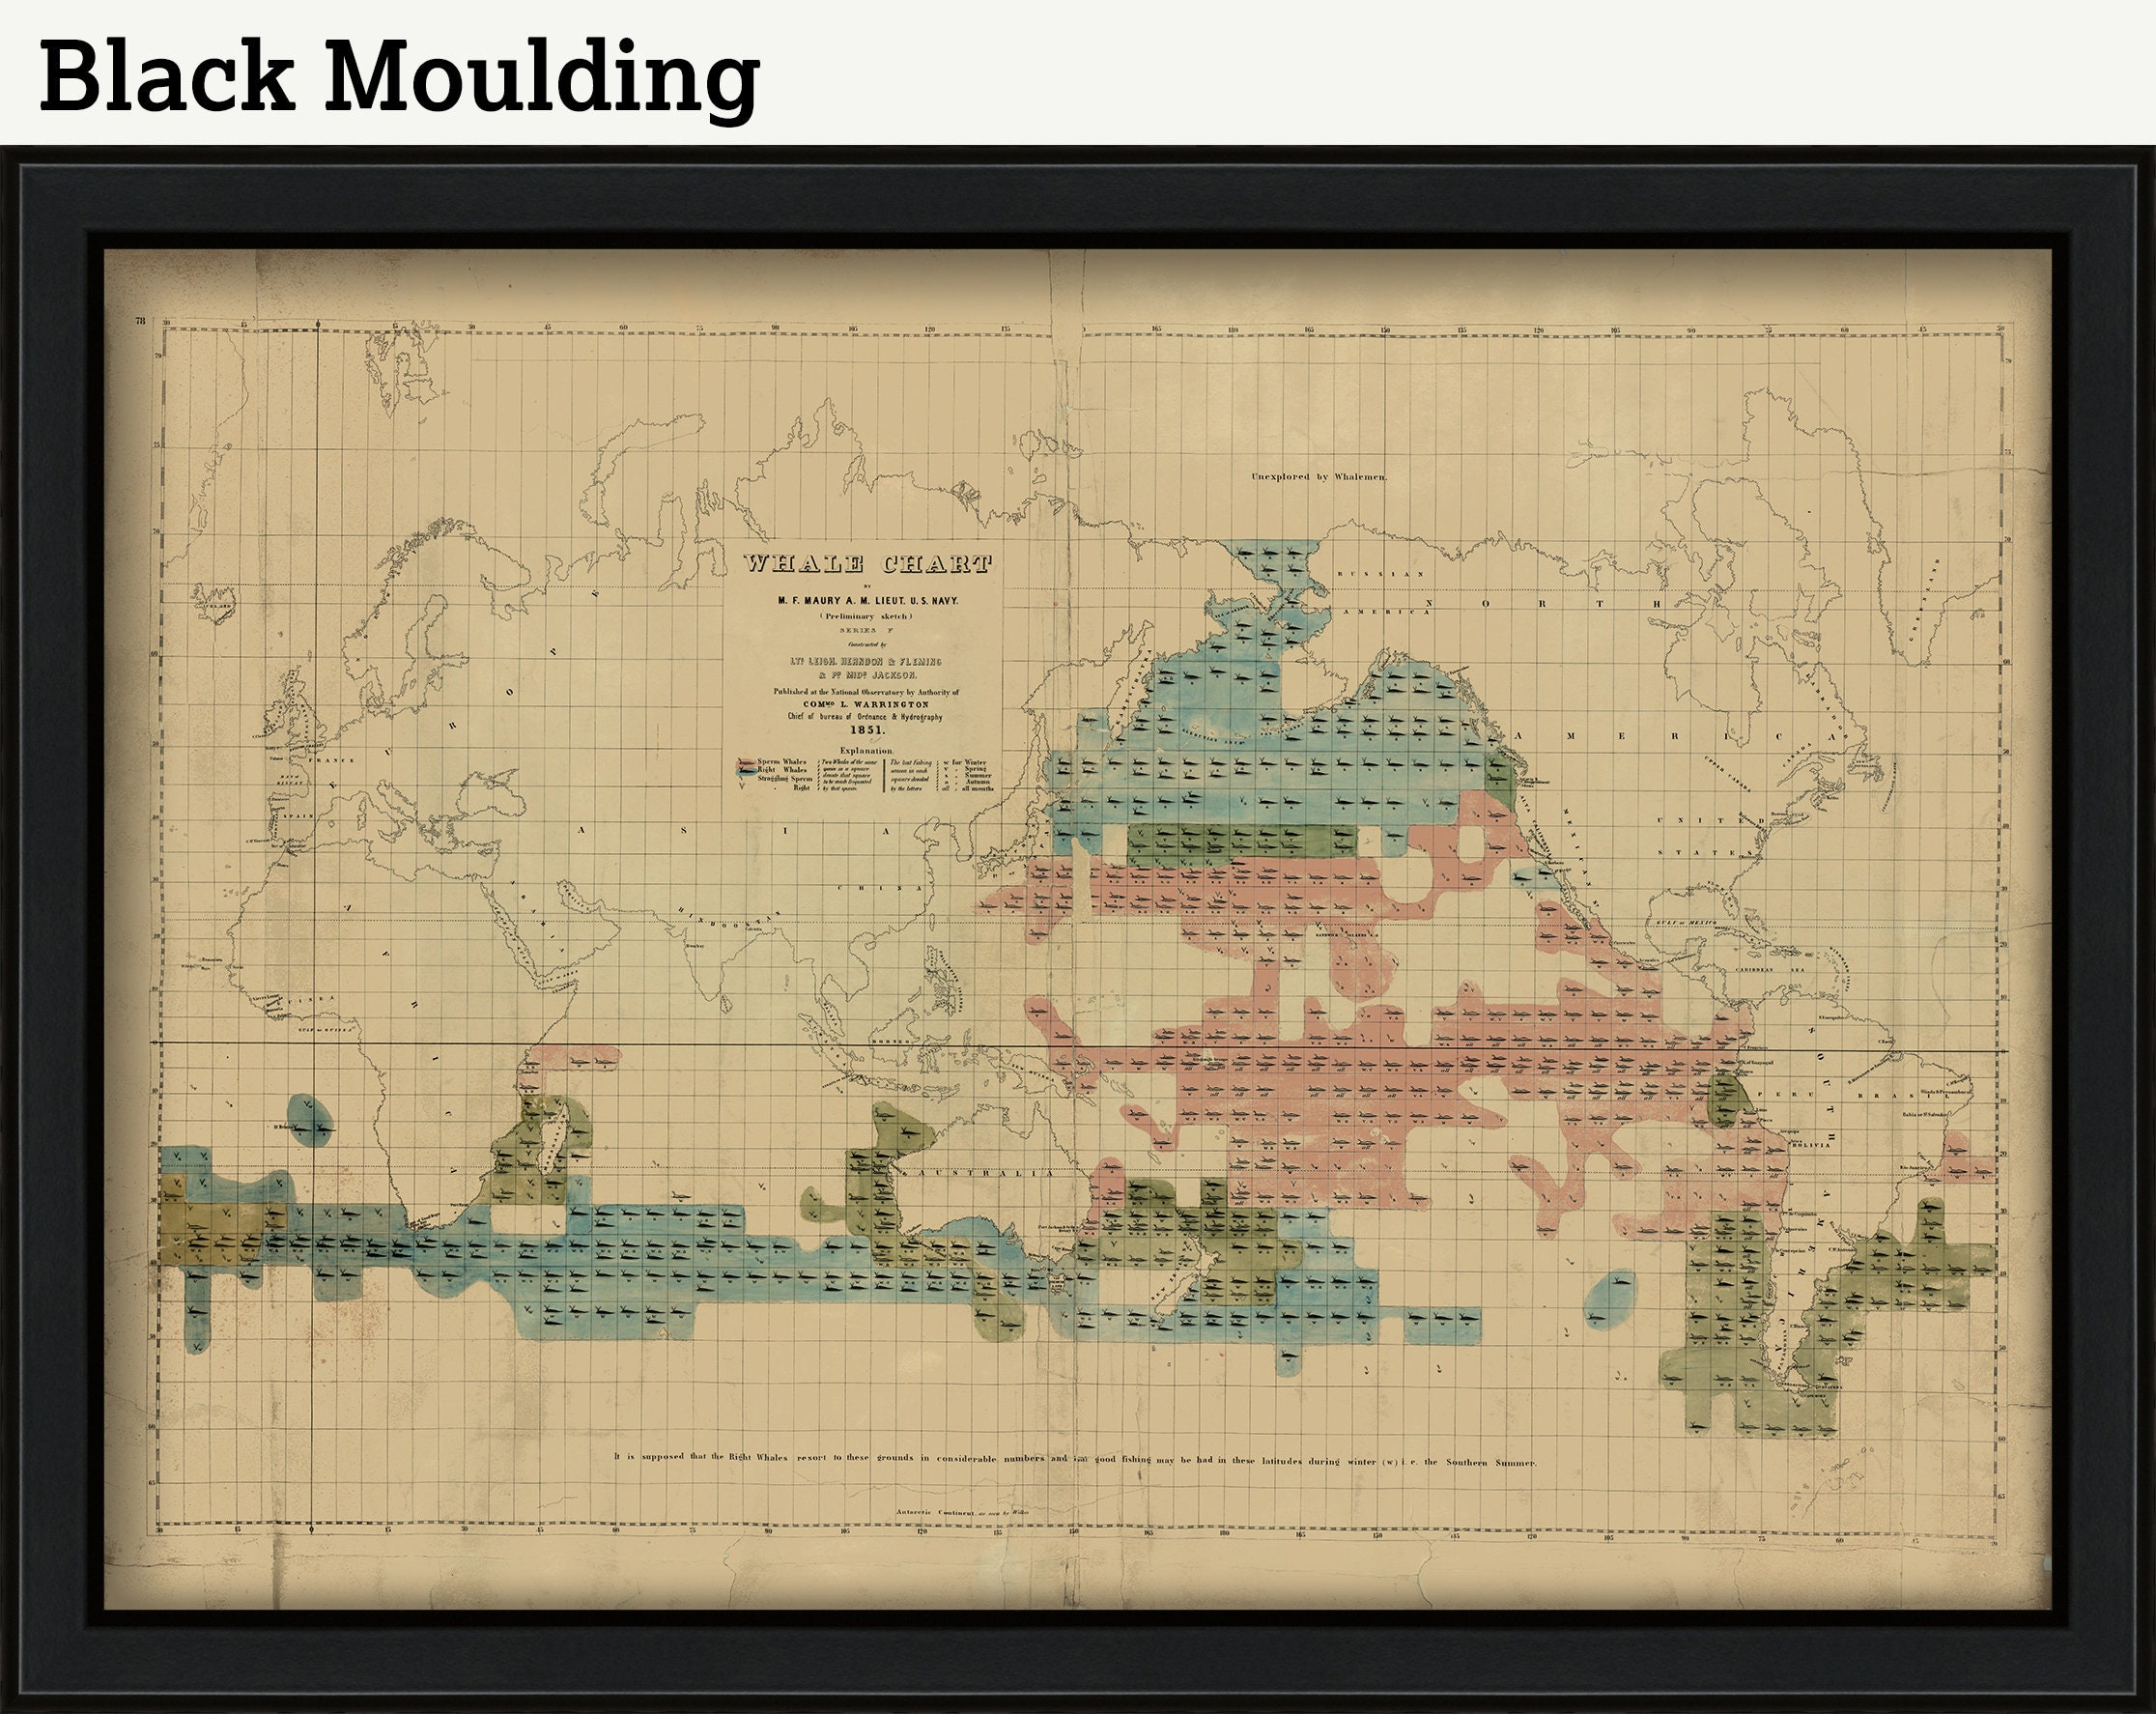
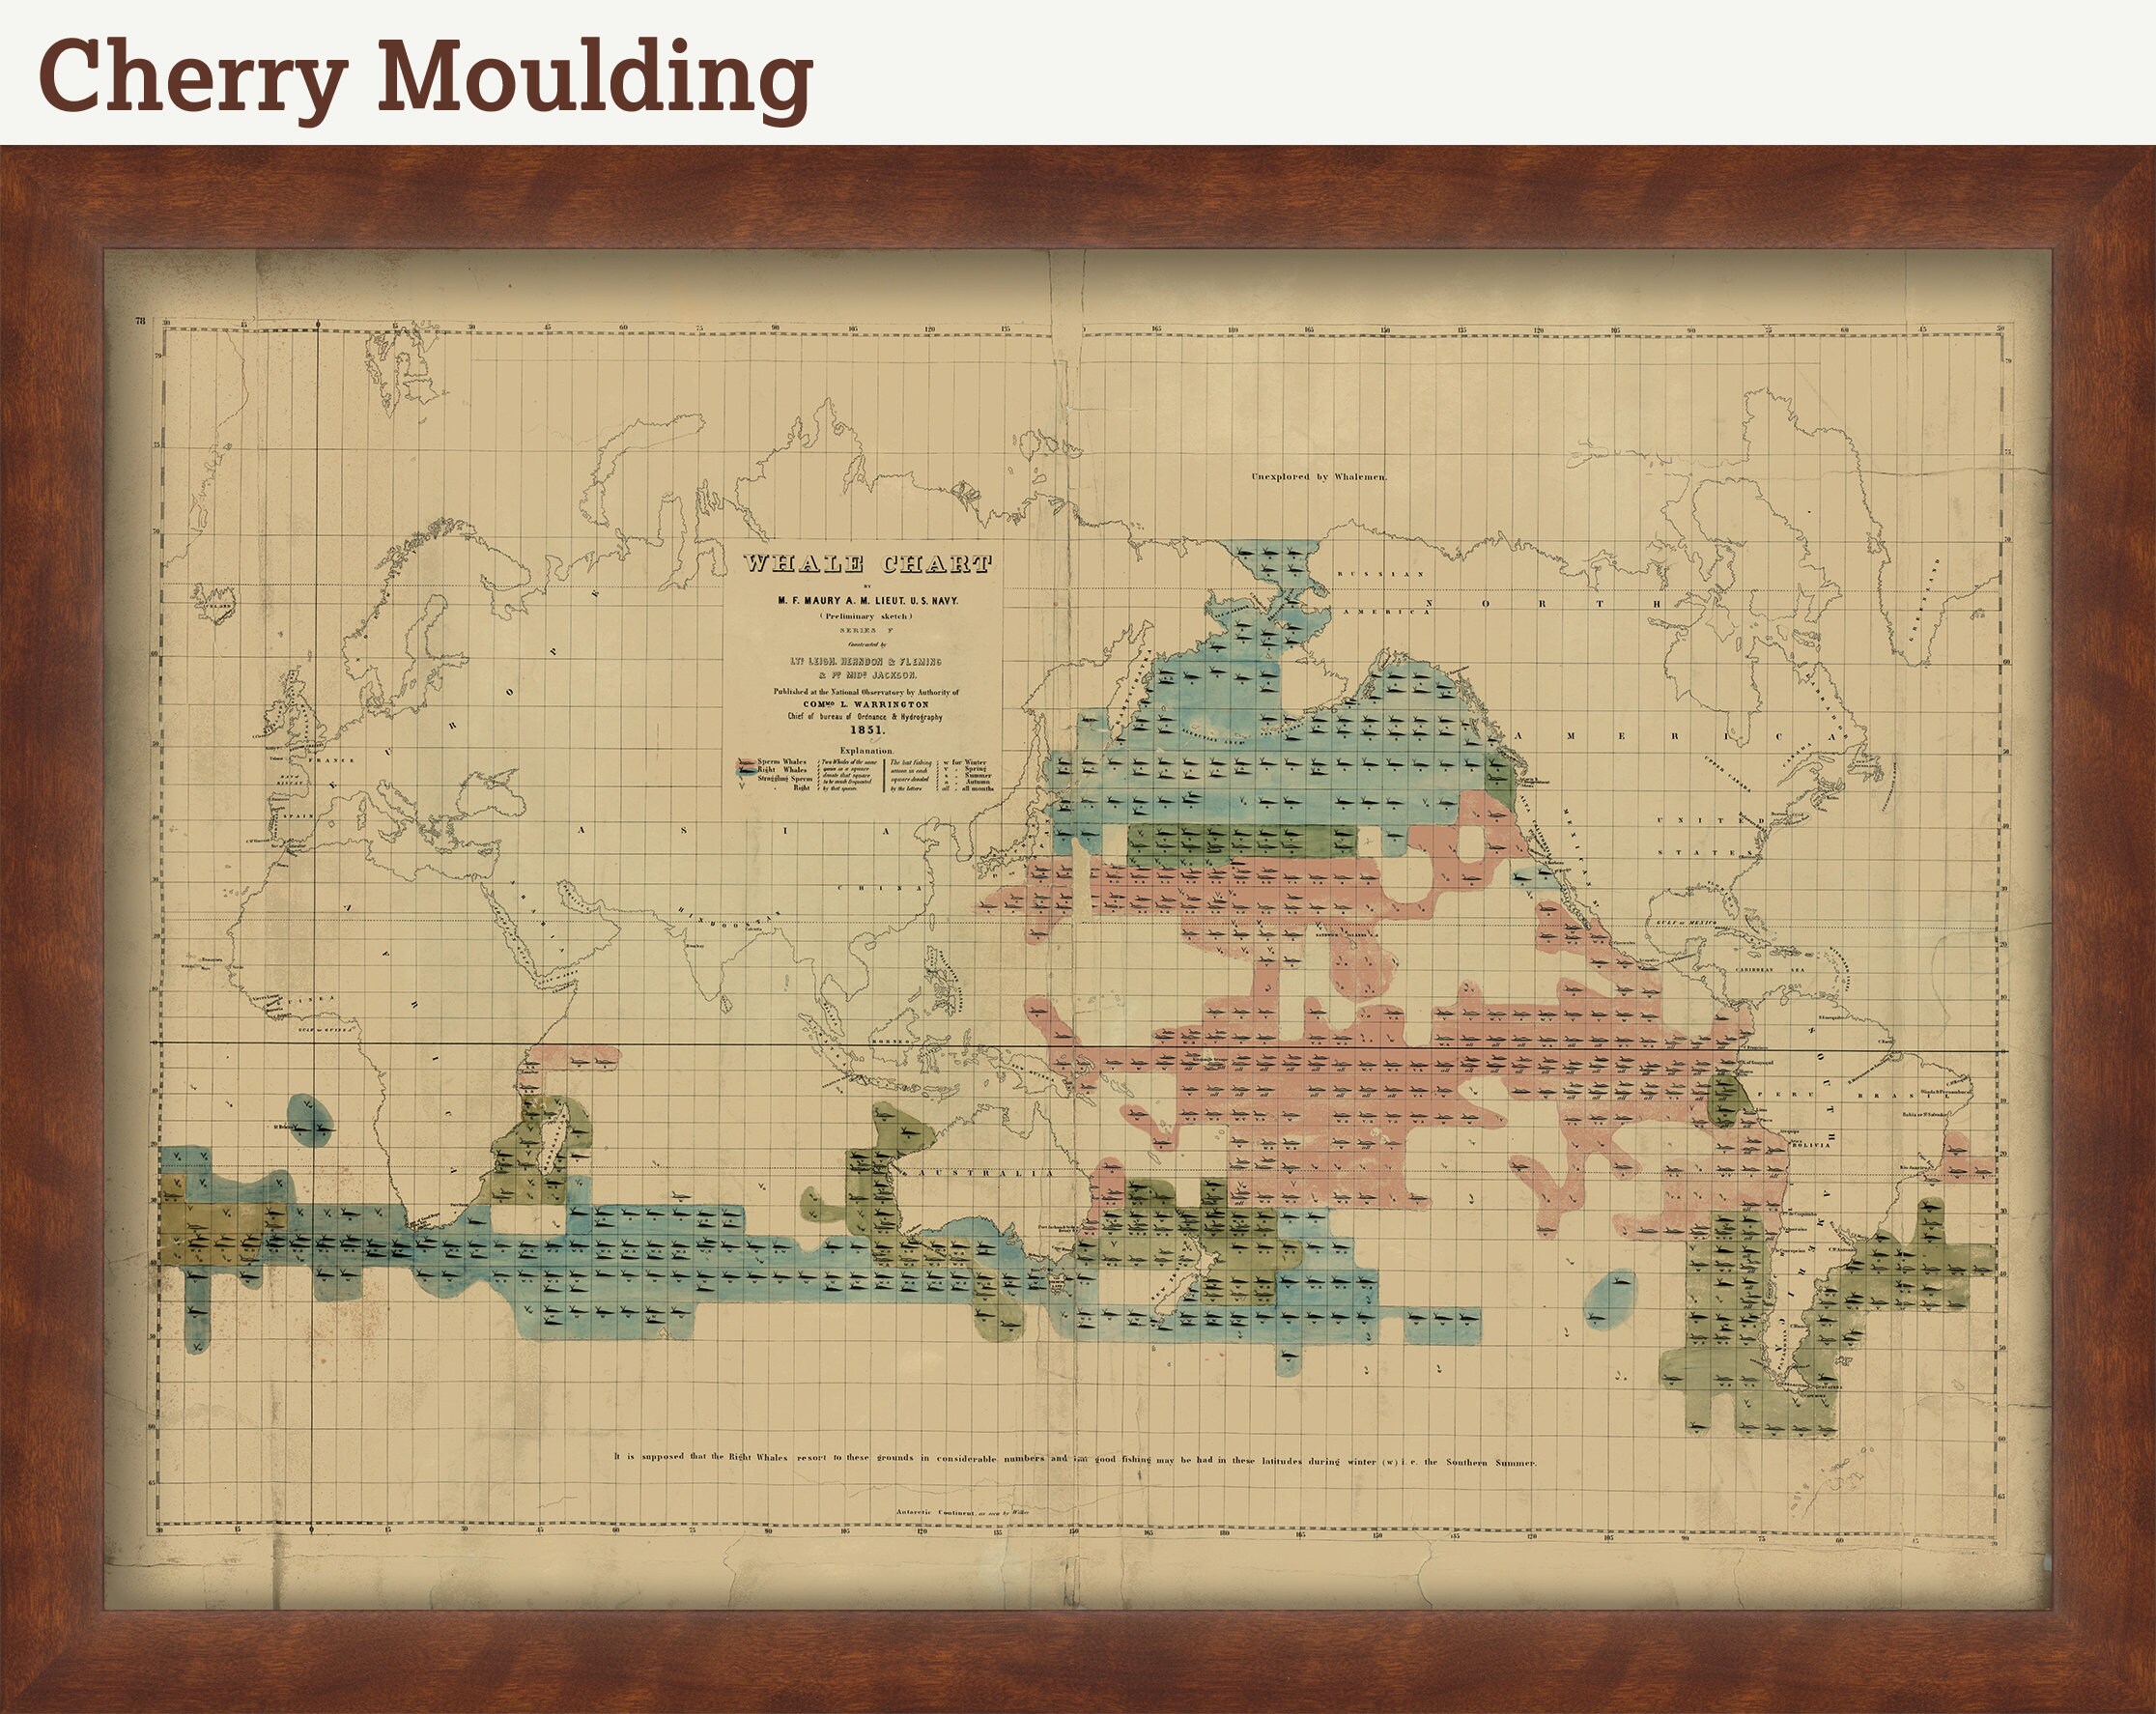
WHALE CHART - Drawn by Matthew Fontaine Maury, Lieutenant U. S. Navy in 1851. To find more whales, the Yankee whaling fleet moved from the Atlantic into the Pacific. In doing so, they expanded the territory known by the United States and facilitated the expansion of American state power.
Matthew Fontaine Maury was an American naval officer who helped develop the science of oceanography. Using whaling ship logs and other data, he compiled this 1851 map of whale distribution in the Pacific Ocean. Pink whales with one spout represent Sperm Whales, particularly prized for their oil; blue whales with two spouts represent Right Whales, which supplied both oil and baleen, or whale bone. Green represents a mixture of the two kinds of whales. The best fishing season for each species is represented by letters below the whale (w for Winter; v for Spring; s for Summer; a for Autumn; all for all months).
This image is printed on heavy matte fine art paper with archival inks. Framing is available. Framed posters include drymounting, UV filtering glass, and your choice of six mouldings, wired and ready to hang upon delivery. All mouldings are approximately 1.5" wide. Please factor in an additional 3" to the listed size for framed items.
Retailers who would like to carry our Maps, please contact us through the "ask a question" button in this listing, for information and discounts.
1742
Shipping from United States
Processing time
1-3 business days
Customs and import taxes
Buyers are responsible for any customs and import taxes that may apply. I'm not responsible for delays due to customs.
Payment Options
Returns & Exchanges
Returns & exchanges not accepted
But please contact me if you have problems with your order
I gladly accept cancellations
Request a cancellation within: 1 hours of purchase